Help Information
This page describes details regarding assembling the input file and specifying various options for MSTmap. We advise users to select parameters based on dataset characteristics, including population type (DH, BC1, Haploid, or RIL) and RIL generations, marker count, data quality, and prior knowledge of chromosome numbers and relative sizes.
-
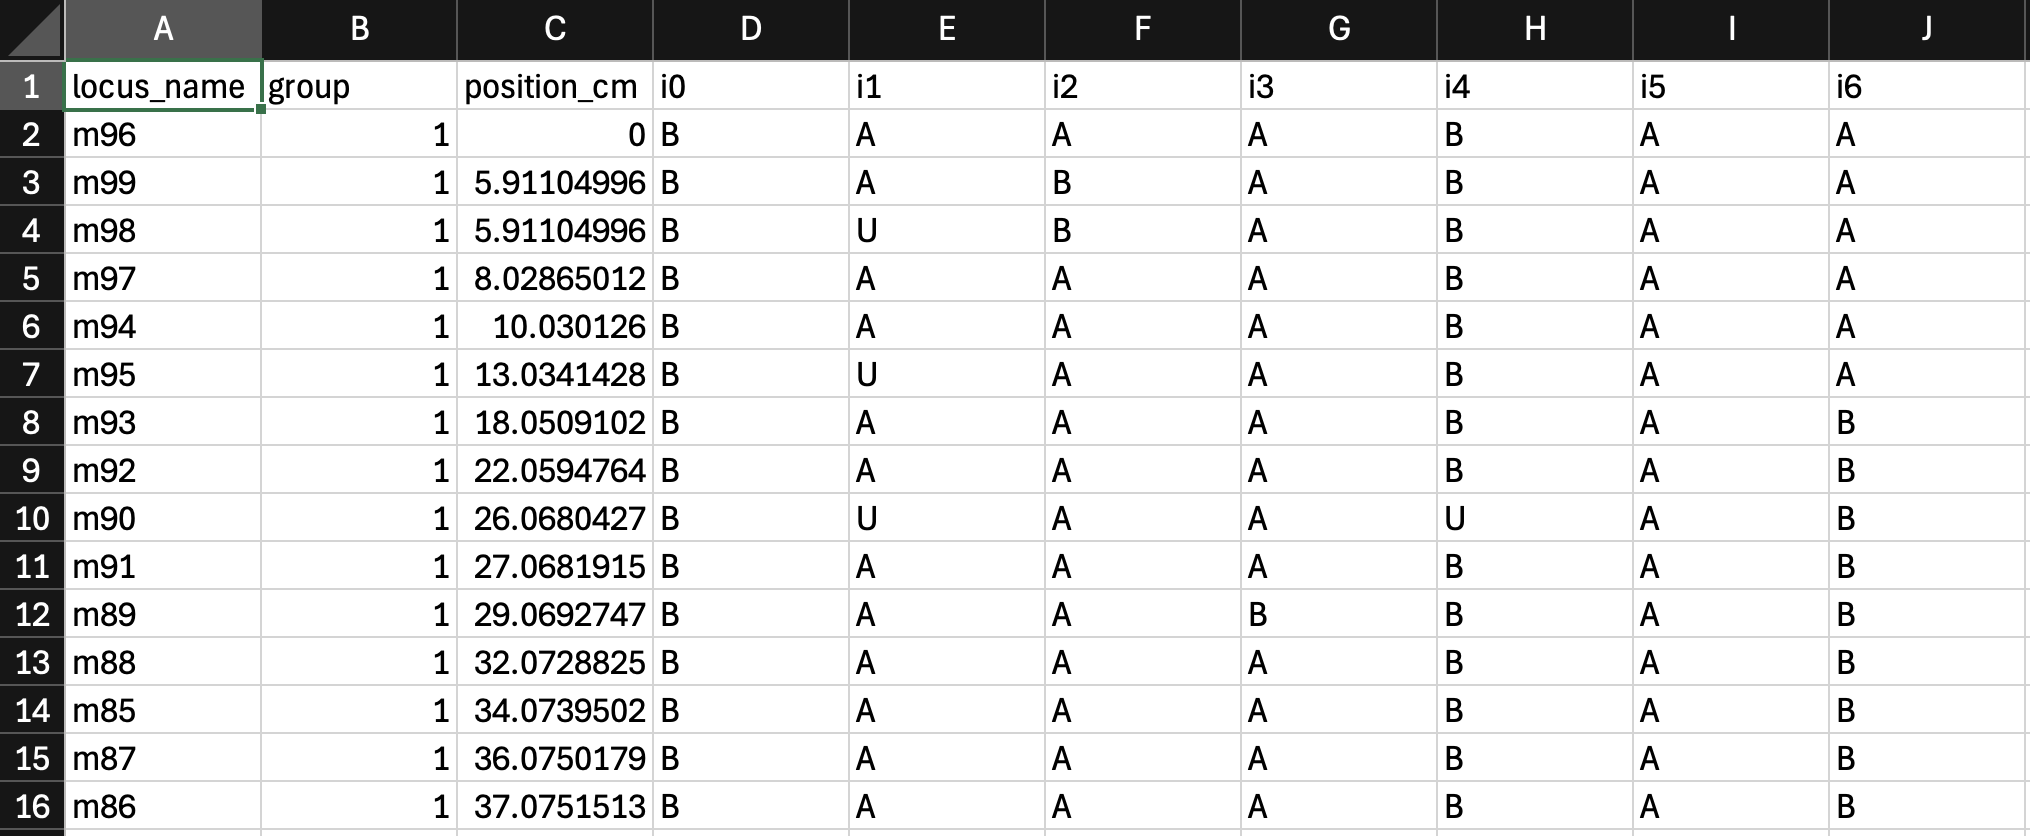
The genotype file is of the tab-delimited text format. It contains a table of dimension (m+1)*(n+1), where m is the total number of markers and n is the total number of mapping lines. The first row gives the ids for the mapping lines, while the first column gives the ids for the genetic markers. Each id is a string of letters (a-z, A-Z) or digits (0-9). No space is allowed within an id. Each cell in the table refers to the genotype state of a particular mapping line on a particular marker locus. The genotype states can be specified with letters 'A', 'a', 'B', 'b', '-', 'U' or 'X'. 'A' and 'a' are equivalent, 'B' and 'b' are equivalent and so are '-' and 'U'. 'U' and '-' indicates the missing genotype call. If the data set is from a RIL population, you can use 'X' to indicate that the corresponding genotype is a heterozygous. Please refer to example.txt for an example.
-
Grouping LOD Criteria specifies the criteria to be used to group markers into LGs. If you wish to put all the markers in one single LG regardless of the pair-wise LOD scores, you can choose "Single LG". If the number of chromosomes is known beforehand, it is advisable to iterate through LOD scores until the highest LOD score yielding the expected number of chromosomes is identified.
-
Population type can be set to either "DH, BC1 or Hap" or "RIL at generation 2-10". Use generation 10 if your RIL population is beyond F10. The generation level is counted as follows. It is 1 for the F1 generation. Each additional inbreeding process will increment the value by 1.
-
No mapping distance threshold and No mapping size threshold together allow one to detect bad markers. In high density genetic linkage mapping, bad markers appear to be isolated from others. MSTmap will detect isolated marker groups and will place them in seperate LGs. An isolated marker group is a small set of markers of size less than or equal to No mapping size threshold and is more than No mapping distance threshold away from the rest of the markers. A reasonable choice for No mapping size threshold is 1 or 2. To disable this feature, simply set No mapping size threshold to 0.
-
No mapping missing threshold specifies the maximum percentage of missing observations allowed per marker locus. MSTmap will remove all markers which contains more than No mapping missing threshold percentage of missing observations.
-
Genetic mapping function specifies the distance function to be used. Possible choices are kosambi and haldane, which refers to the commonly used Kosambi's and Haldane's distance functions respectively.
- MSTmap is able to detect erroneous genotype calls during the mapping process. To turn on this feature, set Try to detect genotyping errors to yes. The default is to have this feature turned off. If this feature is turned on, rare recombination events will be treated as errors. As a consequence, fewer bins will be produced.
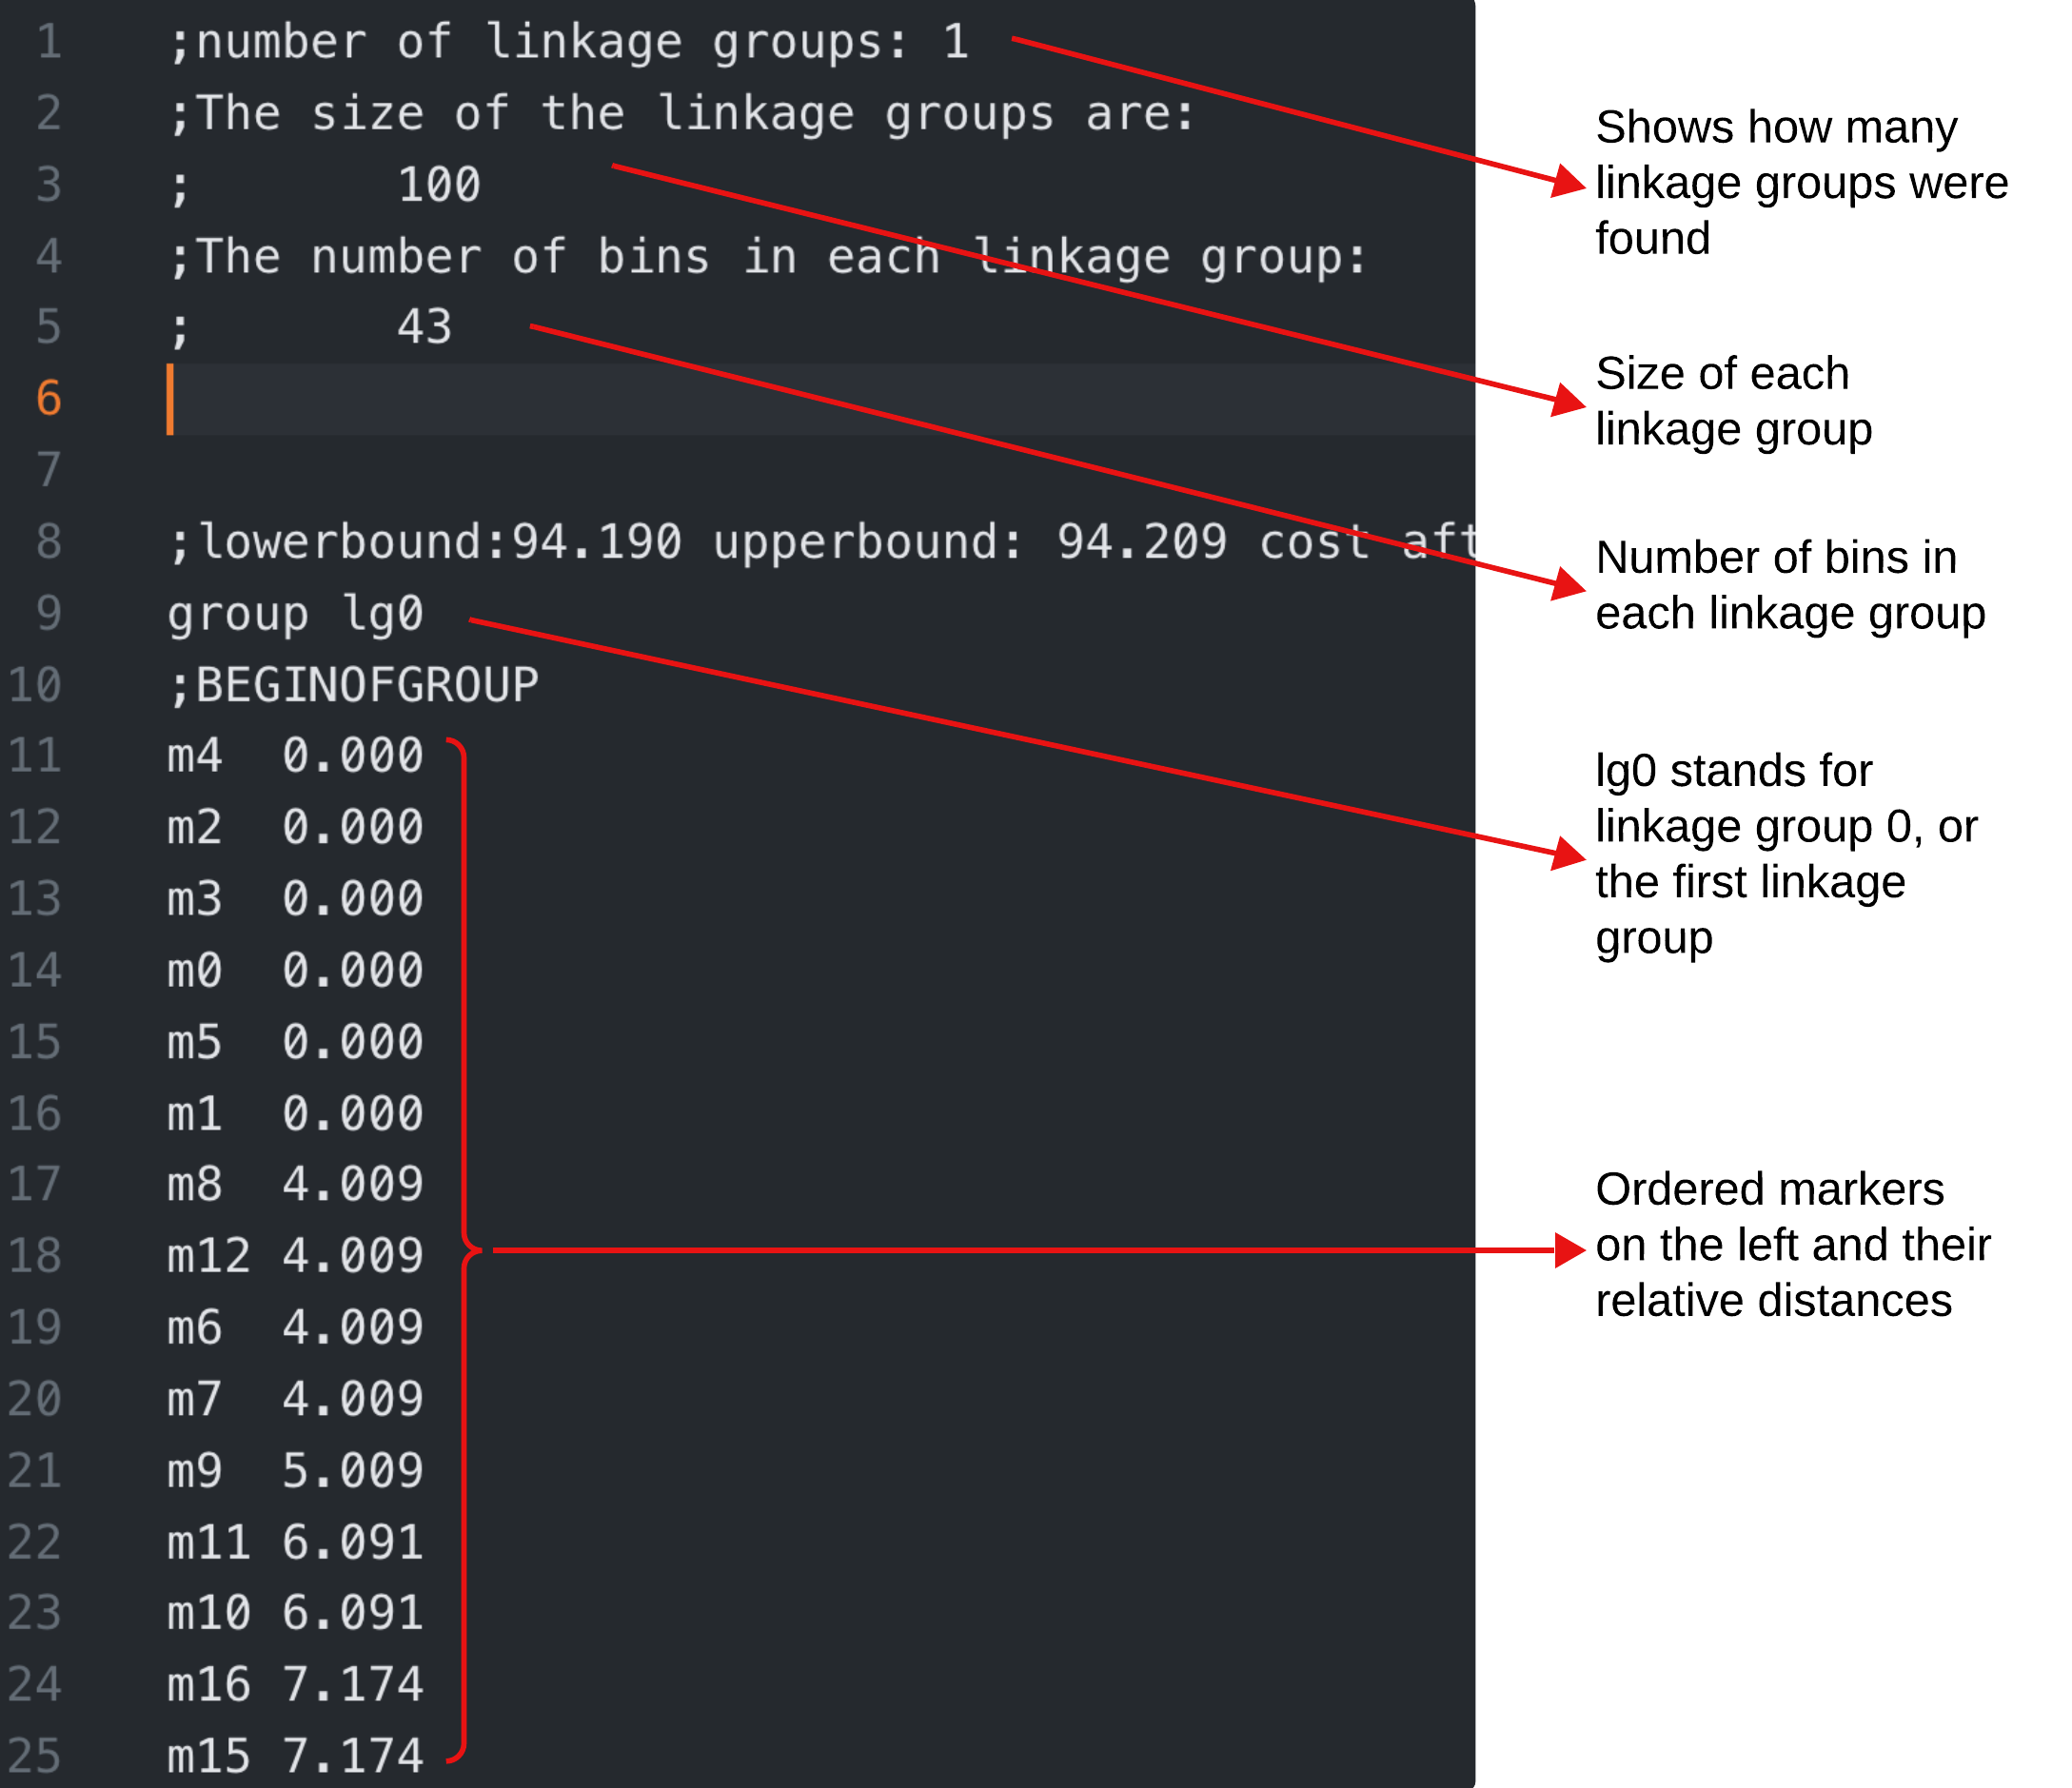
How to Interpret the Output File
The output file is self-explanatory and easy to understand. It simply lists the markers in each linkage group. The genetic distances between markers are also available from the output file. Please refer to example_map.txt for an example.
In addition, we provide a second output TSV which includes the ordered markers according to their linkage groups and distances.